By Allen Vaughan, Cat Pate and Randy Pazzaglia
Technology has progressed from laser survey equipment to 3D scanners, then to LiDAR drones, and now to Li-DAR phones. The emphasis of new, developing technology has always been on precision and accuracy, with secondary considerations varying depending on aesthetics, time, and cost. Experts in crash investigations, be it police personnel or private accident reconstructionists, have always looked at data collecting technology with the knowledge that their procedures and the technology itself may be challenged in a courtroom for accuracy and reliability.
If the technology being used does not pass the first stage of qualification, that of precision and acceptable accuracy, then the technology is not going to be used in a courtroom setting. If it does pass that first stage, the next question should be, does the technology, although precise and accurate, bring value to comprehension of the facts? Labor costs are usually limited during an investigation; so one must also ask, how efficient is the product compared to other products? How much time and effort go into learning how to use and implement the tool and its associated programs, and how much time is taken in actual use of the product compared to other options?
Considering the advancements in LiDAR phone technology, it could potentially be the most accurate and most efficient tool to use in a crash incident investigation. But, has this 3D technology truly reached its potential? How does it work? How easy is it to learn and use? Are there other comparable technologies that can compete with currently established technologies?
ATA Associates completed a comparative study of the following:
- iPhone (Scaniverse, Recon-3D, Polycam, PIX4Dcatch) vs. 3D Digitizers (FARO)
- Photogrammetry (Context Capture) vs. 3D Digitizers (FARO)
- Cell Phone Survey Equipment (Moasure ONE) vs. Traditional Survey Equipment (Trimble)
A description of the tests conducted and a presentation of the results follow.
UNDERSTANDING OF COURT QUALIFIED TECHNOLOGY
Courtroom technology and experts are qualified under two different standards that vary from state to state. The most common standard is the Daubert standard, and the less common standard is the Frye standard.
The Daubert standard1
The factors that may be considered in determining whether the methodology is valid are: (1) whether the theory or technique in question can be and has been tested; (2) whether it has been subjected to peer review and publication; (3) its known or potential error rate; (4) the existence and maintenance of standards controlling its operation; and (5) whether it has attracted widespread acceptance within a relevant scientific community.
The Frye standard2
This standard must determine whether the method by which that evidence was obtained was generally accepted by experts in the particular field in which it belongs.
Both standards hold requirements of the established method of data collection to be understood and approved by a variety of experts in the field. Validating and cross-checking methodologies has been essential in allowing all involved parties to evaluate processes to ensure accuracy. This test seeks to meet the expectations of these courtroom standards.
3D DIGITIZING SCANNERS, SURVEY EQUIPMENT, PHOTOGRAM-METRY SOFTWARE AND PREVIOUSLY QUALIFIED TECHNOLOGY
For the past 10 years, or so, accident reconstruction technology has remained consistent. Reliable equipment like Spectra survey equipment, 3D digitizing equipment (FARO, Trimble, etc.) has been a crucial part of data collection. Photogrammetry software has also been available for accident investigations, but at a varying capacity over the years. Working in conjunction with all three technologies has resulted in complete data collection.
Let us use the Spectra survey equipment as an understanding of the importance of improving technology and always utilizing the most updated methods of data acquisition. The survey equipment took the place of having to take physical measurements at a site, (using a measuring rod and handwritten notes), and indirectly made the job safer and more efficient by saving time spent on an active roadway and other dangerous settings. Expected costs for survey equipment in 2023 range from $15,000 to $30,000. Using the simple example of the documentation of a 3-way intersection, we can understand the time differences between methods. Physical measurements would take approximately 2 to 3 hours of time to document, while survey equipment would take approximately 1 to 2 hours. Due to budgets and time allotments being a part of the project consideration, the newer technology can increase productivity, leaving more time for analysis and case evaluation.
3D digitizers and photogrammetry software have been instrumental in creating a more efficient workflow versus using survey equipment. Two 3D digitizers were used during this testing process – FARO and Trimble. FARO hardware can be purchased for between $40,000 to $60,000 and Trimble hardware costs between $40,000 and $50,000. FARO software costs approximately $3,000 to $6,000 a year in subscription fees, and Trimble costs from $1,500 to $3,000. The quality of the final product for both 3D digitizers is, for all intents and purposes, identical.
The difference is in the collection methodology. The FARO hardware collects and saves the data to an SD card, while the Trimble system uses a tablet connected to the data collection device that monitors the scans in real time. Once the data is collected, FARO requires the operator to process the scans via FARO Scene software. The Trimble tablet automatically processes the scans as the scans complete, and modifications can be made via software on the tablet. Although it is convenient to view the work product in the field; the tablet adds an expense of approximately $2,000, not to mention the expense of batteries. FARO and Trimble are both established products that offer reliable data.
Photogrammetry software in 2010 was not robust enough to process sites through the use of photographs only. Hours of work would go into setting up the site and taking proper photographs. Then, there is the subsequent processing time. However, as softwares receive updates and patches, the softwares become more and more efficient. These updates and patches have progressed softwares to become robust enough to process 3-dimensional objects using photographs alone. Along with this advancing technology comes the price of the camera and approximately $3,000 a year for a software subscription. But how accurate is it? Our discussion on accuracy follows.
DRONE, IPHONE AND NEWER TECHNOLOGY
The introduction of new technology always raises questions: Can it improve consistency? Is it faster than what we already have? How much will it cost to train and use it? Who can use it? We looked at these new technologies to explore those possibilities for investigators who need to collect data in real world crash sce-narios.
By 2019, photogrammetry softwares began producing orthorectified images that properly met the measurements and scale of the roadway. These softwares exponentially improved in the following months and years. Using cameras that produce complete metadata such as F-stop, ISO speed rating and exposure time, the software will produce accurate results. Drones are a regular site inspection tool, along with software like Pix4d and Context Capture to create an orthomosaic image of the site. Investigators no longer have to survey in dangerous roadway conditions as a result of this progressing technology.
As of March 2023, the DJI website lists the Mavic 3 by itself for $2049 and $2849 if you bundle it with useful accessories like additional batteries, a battery charging hub and carrying case. The DJI website and YouTube both have tutorials on how to fly the drone safely with helpful tips for troubleshooting. With a little practice and a state issued license to fly a drone commercially, a novice can easily take high quality photos and videos for use in accident reconstruction. The iPhone 14 Pro Max is available on the Apple website for $1099 for 128GB and up to $1599 for 1TB.
You also need to factor in the cost of cell phone service to fully utilize the iPhone’s capabilities. With a 6.7-inch display screen, the iPhone 14 Pro Max is a larger phone but still smaller than the FARO display screen. And weighing in at only 9 oz., the iPhone is an easier option than carrying the 4.4 kg FARO scanner and tripod to and around an accident scene. The iPhone scanning applications can be purchased as a monthly subscription or an annual basis, with Scaniverse currently offered as freeware. The monthly subscription ranges from $16.99/month to $49.99/month. Most annual subscriptions are about $399 to $449.
The relatively short amount of time needed to scan a vehicle is where the iPhone applications shine. We were able to scan an entire vehicle in the same amount of time the FARO Scanner can scan one corner of the same vehicle. At the end of the scan, some applications generated a 3D model within a few minutes; other applications required a few hours to process in the cloud, but they all use automatic processing within the camera, unlike the FARO which requires a user to manually process and assemble the scans.
Comparable to the Spectra survey system, Moasure ONE is a motion-based measuring tool that allows a user to measure and plot a survey on its smartphone application simultaneously. The Moasure ONE is a small device, about the size of a hockey puck, and is available for $449 from its website. The Moasure Stick, available for an additional $75, is an extendable accessory tool recommended for easier measuring. The smartphone application is available for free on both Apple and Android and connects to the Moasure ONE with a Bluetooth connection. Taking a measurement is straightforward and easy, with options to measure a straight line, an arc and along a wall surface. It is recommended that no more than 6-8 seconds elapses from one survey point to the next, which based on test measurements is about 20-30 feet. The application allows you to add layers to keep you organized, automatically calculates the area of closed shapes, and captures changes in elevation too.
EXPERIMENTAL METHODOLOGY
Goal
To compare technology error margins to determine if newer technology matches or exceeds already court-qualified technology.
How
Conditions of a planned incident site were established to set up a controlled environment in which measurement variables were all known. Extensive physical measurements were taken to compare subsequent measurements made using technology. Measurements were taken using the following equipment:
- 3D Digitizer (FARO Scanner)
- 3D Digitizer (Trimble)
- Photogrammetry (Drone – Mavic Pro 3)
- Photogrammetry (Camera – Sony Cyber-shot RX100 VII)
- Survey (Spectra Survey)
- Survey (VBox Data Logger) Survey (Moasure ONE)
- iPhone Lidar Scanning (PIX4Dcatch Application)
- iPhone Lidar Scanning (Scaniverse)
- iPhone Lidar Scanning (Recon-3D)
- iPhone Lidar Scanning (PolyCam)
- iPhone Lidar Scanning (SiteScape)
The measurements were taken of the following items:
- Simulated Incident Site: (Photogrammetry {Drone}, iPhone Li-dar Scanning {Recon-3D, Scaniverse}, Survey {Spectra}, 3D Digitizer {FARO Scanner})
- Box Truck: (Photogrammetry {Sony Cyber-shot}, iPhone Lidar Scanning {Recon-3D, PIX4Dcatch, Scaniverse, SiteScape, PolyCam}, 3D Digitizer {FARO Scanner})
- Ford F-150: (Photogrammetry {Sony Cyber-shot}, iPhone Lidar Scanning {Recon-3D, PIX4Dcatch, Scaniverse, SiteScape, PolyCam}, 3D Digitizer {FARO Scanner})
Where and When
- Location: Eastfield Dr., between N. Village Dr. and Retail Dr., Webster, Texas
- Date: Wednesday, December 7, 2022 Time: 9:00 am – Noon
The location was chosen due to its minimal traffic, its ease of access, and its functionality with establishing a site. Time restrictions were not an issue, which allowed for verified results and to make sure each piece of equipment had sufficient time to complete its assigned task.
EQUIPMENT USED FOR EVALUATION
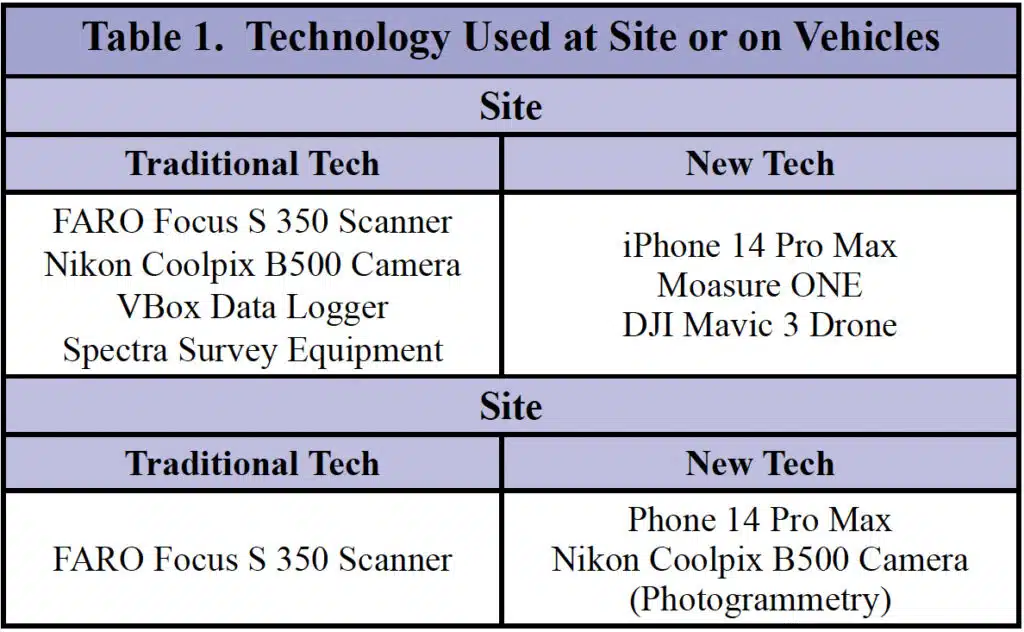
The site was photographed using an iPhone 14 Pro Max, a Nikon Coolpix B500 camera and by a DJI Mavic 3 drone. The site was scanned using a FARO Focus S 350 scanner and the iPhone 14 Pro Max. Survey data of the site was captured by the Spectra Survey equipment, VBox Data Logger and the Moasure ONE.
The vehicles were photographed using an iPhone 14 Pro Max and a Nikon Coolpix B500 camera. In addition to being scanned using a FARO Focus S 350 scanner, the vehicles were also scanned using five applications available to the iPhone 14 Pro Max. These are Scaniverse, SiteS-cape, Recon-3D, Polycam and PIX4Dcatch.
Photographs of the site and vehicles were processed with Context Capture to create 3D models for comparison purposes.
TESTING LOCATION AND SET-UP
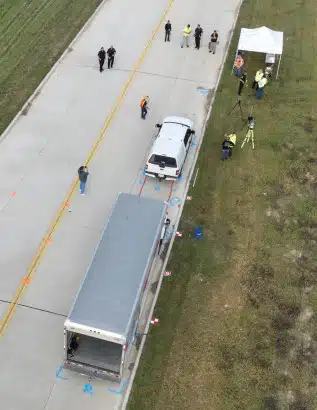
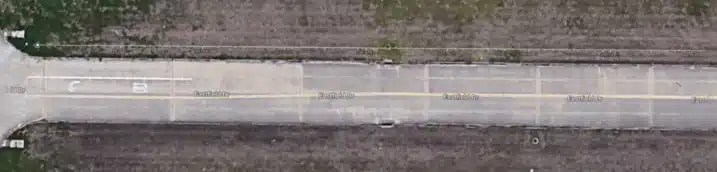
The location of the test was on Eastfield Drive, between North Village Drive and Retail Road, in Webster, Texas. This newly constructed portion of Eastfield Drive is approximately 700 ft long with two-way traffic lanes and a yellow center stripe clearly painted on the road. On the day of the test, officers from Harris County Constable Precinct 8 and Webster Police Department created a safety barricade with their vehicles at each end of the road to prevent vehicles from entering the test area.
The test scenario was as follows: a Ford F-150 truck was stationary on the northbound lane of Eastfield Drive when it was hit from behind by a 26-foot box truck, pushing the F-150 forward and leaving skid marks on the road by both vehicles. The impact caused the box truck to leave transmission fluid on the ground at the Area of Impact (AOI), which we set at the fire hydrant on Eastfield Drive, approximately 350 feet north of the intersection of Retail Road and Eastfield Drive. The F-150 was also damaged, leaving debris from the taillight assembly near the AOI. ATA Associates mimicked police markings drawn on the road to indicate AOI, skid marks, transmission fluid, debris, and tire locations of both vehicles.
PROCEDURE
- All environment sensitive scanning done within an hour.
- Vehicles scanned on site and independently used technologies to properly scan.
- A scan or device was recognized as a failure if not completed within an hour. If scan or device failed, then one retry would be granted.
With Vehicles On-Site (Scenario 1)
Once Eastfield Drive was blocked from public use, we gave each piece of equipment one hour to make on-scene adjustments to complete its assigned purpose. We positioned the box truck and F-150 on the road according to the markings we had previously painted on the road. The FARO scanner was positioned to scan the vehicles on site at 6 different scan points. The site with vehicles was then photographed with the following:
- iPhone 14 Pro Max
- Nikon Coolpix B500 Camera
While the FARO was scanning, we flew the drone overhead to photograph the site aerially and photographed the vehicles for Context Capture. Using both the iPhone 14 Pro Max and Nikon Coolpix B500 camera, we photographed the vehicles from three heights (approximately 2 ft., 4 ft. and 6 ft.) then moved about 2 ft. laterally and repeated the process until we had completely circled the vehicle. After photography and FARO scanning was completed; we subsequently scanned the vehicles and site with the iPhone applications.
Without Vehicles On-Site (Scenario 2)
Once all the vehicles were photographed and scanned at the site, we moved both the F-150 and box truck off-site to re-create a more realistic scenario since most accident reconstructionists do not have the opportunity to view the vehicles at the accident site. The site was then photographed with the following:
- iPhone 14 Pro Max
- Nikon Coolpix B500 Camera
- DJI Mavic 3 Drone
- Other site documentation included:
- V-Box Data Logger
- Survey (Spectra Survey system)
- Moasure ONE (Survey System)
Multiple drive-through passes were made while recording the site layout with a VBox Data Logger. The VBox data would be used to verify the site surveys, executed with the Spectra survey system and then the Moasure survey system. The survey responded with expected accuracy and clarity, taking approximately 45 mins from setup to finish of operations. The Moasure system lost Bluetooth connectivity with the iPhone 14 Pro Max multiple times. Unlike Spectra, if Bluetooth connection was lost, the application restarted and the survey data was lost. While simply inconvenient for a small site like ours, this would be a major issue for a larger site. An upside is this does not affect the accuracy of collected data, and the Moasure connection issues seem to be able to be fixed via patches and updates. Having concluded the testing session at Eastfield Drive; we moved the F150 and box truck to the ATA Associates facility to replicate scanning at an off-site location. We photographed both vehicles with the iPhone 14 Pro Max and the Nikon Coolpix B500 camera and scanned them with both the FARO and iPhone scanning applications.
FINDINGS
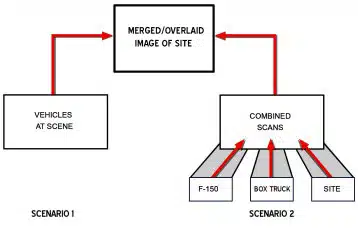
To establish a better understanding of accuracy over a broad but practical field of data, two test scenarios were conducted. Scenario 1 was the documentation of components in their respective locations at the scene of the crash and Scenario 2 was the documentation of individual components as it would be done independently in a post-incident setting. This is portrayed by the flow chart in Image 3.
In theory, if every scan and the subsequent processing of that scan was perfect, then every 3D graphic would overlay without error. This graphical analysis is supported by numerical analysis in which measurements taken from the actual site and vehicles are compared in a 3-dimensional (X,Y,Z) format to measurements taken from the 3D renderings. Any differences that were found between the physical measurements and those in the 3D renderings determined source accuracy.
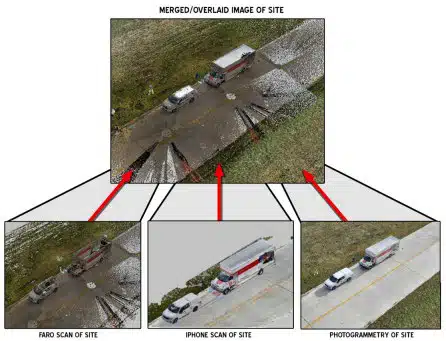
The first scenario’s documentation is graphically portrayed in Image 4. This method of documentation was done with the vehicles in their final rest locations at the scene. The exercise was to test a larger scale of documentation using the same techniques as in the second scenario, to discover failure modes, range, and determine if accuracy is affected by larger area scans.
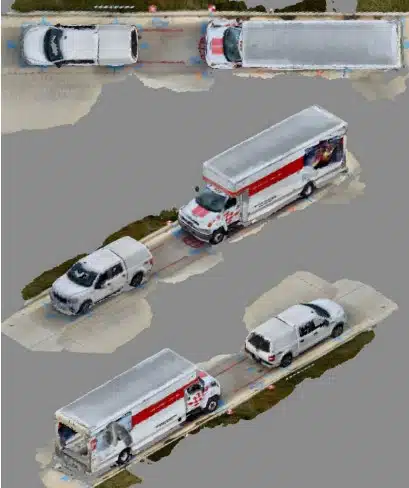
The following technologies were used in establishing the first scenario:
- D Digitizer (FARO)
- iPhone Scan (Scaniverse and Recon-3D)
- Photogrammetry (DJI Mavic 3 drone)
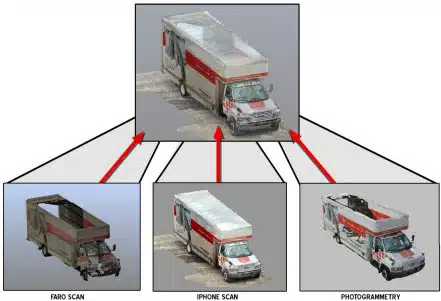
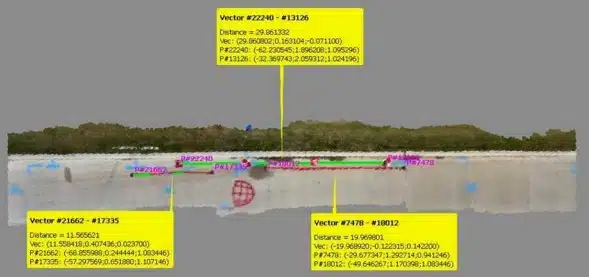
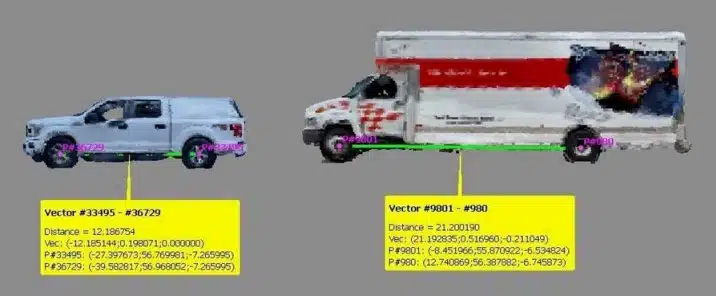
The second scenario’s documentation is graphically portrayed in Image 5 using the box truck as an example of the approach used in constructing the 3D imagery of each subject. This method of documentation was done by documenting each of the subjects independently. The exercise was to discover failure modes, range and determine if accuracy is affected by larger area scans.
The following technologies were used in establishing the site accuracy and source accuracy:
- iPhone 14 Pro Max
- Nikon Coolpix B500 Camera
- DJI Mavic 3 Drone
- V-Box Data Logger Spectra Survey system
- Moasure ONE survey system
SCENARIO 1 – WITH VEHICLES ON-SITE
Scenario 1 compiled data with the vehicles in their final rest locations and used the following technologies:
- 3D Technology Digitizer (FARO)
- iPhone Scan (Scaniverse and Recon-3D)
- Photogrammetry (DJI Mavic 3 Drone)
The 3D digitizer was stationed in 6 locations in order to both properly scan the site and give the scanner enough room to document all essential wreckage scene components. While the 3D technology digitizer was scanning, the same operator was able to fly the drone and complete the photographs required to construct a 3D rendering. Ninety-nine photographs were taken as input to generate 3D imagery. These photographs were then processed using Bentley Context Capture software. Another operator oversaw the iPhone scanning and documentation.
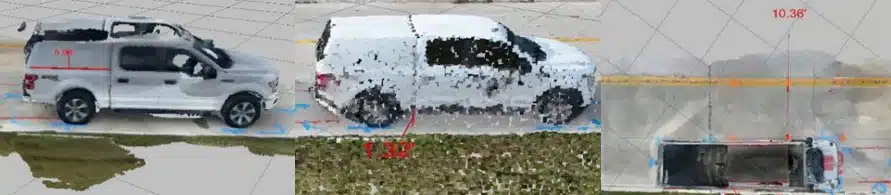
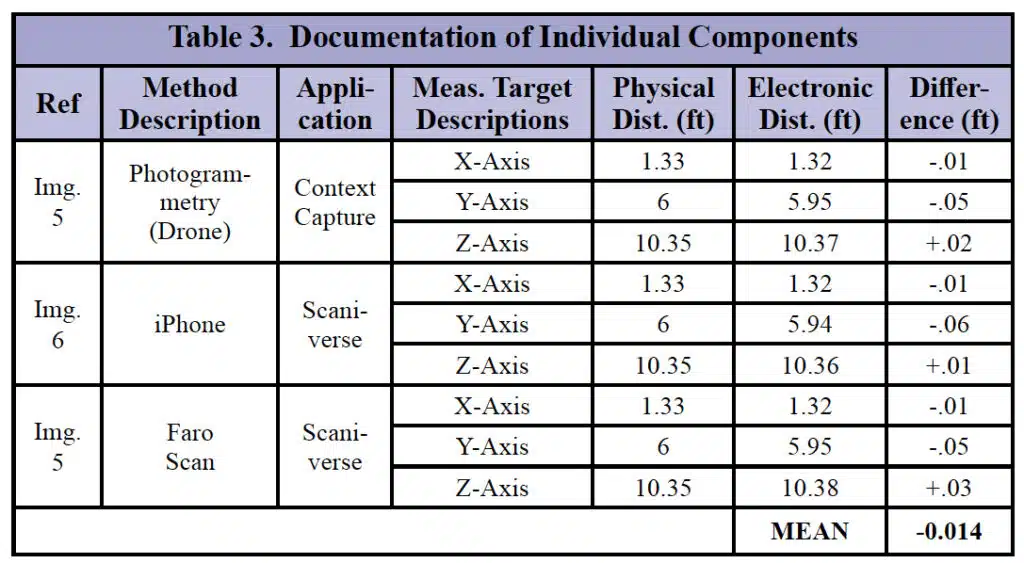
The configuration allowed for a variety of “X,Y,Z” comparable locations to be assessed. Table 3 shows one set of scene specific “X,Y,Z” location measurements that were chosen. Using scene specific measurements ensures integrity by safeguarding against using standardized road dimensions.
SCENARIO 2 – WITHOUT VEHICLES ON-SITE
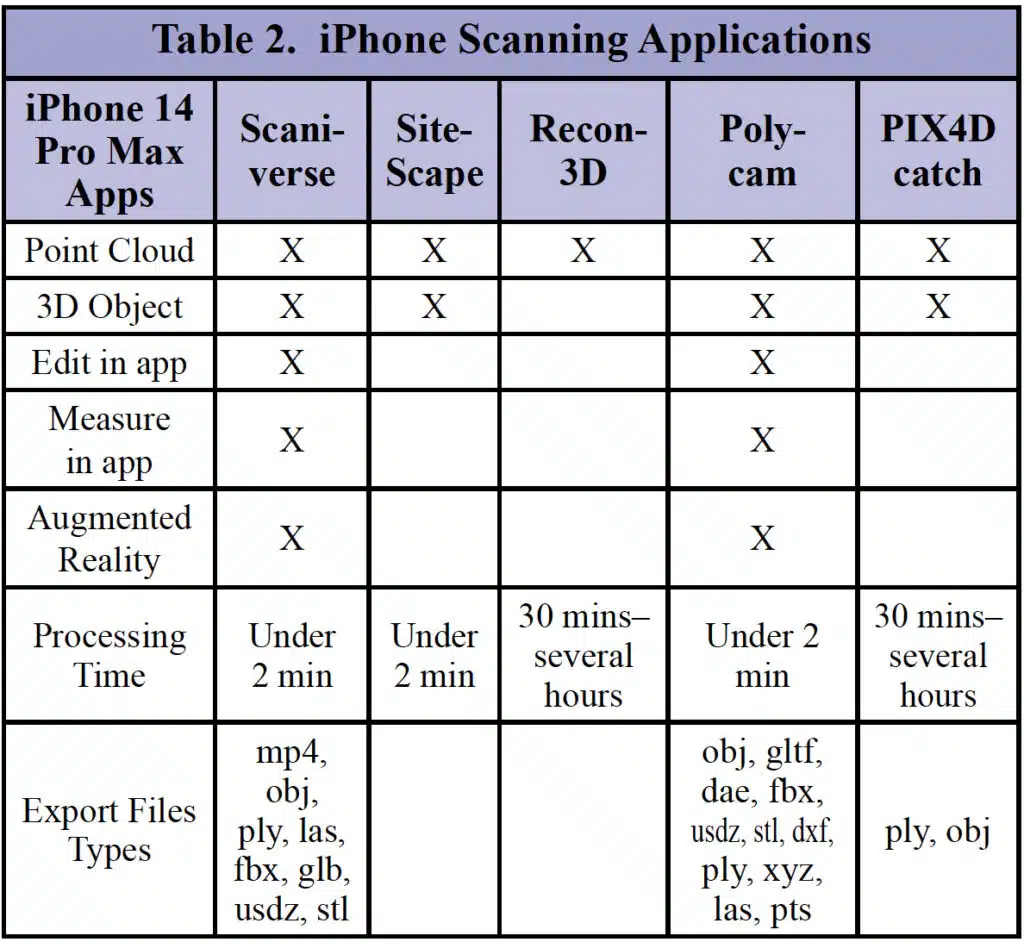
In comparing the two iPhone software applications, both were easy to operate, how-ever, both had scan speed as well as range limtations. Range limitations were likely related to the iPhone’s LiDar scanning sensor that appeared to have a maximum depth of only five meters. However, Recon-3D software applied a photogrammetric technique increasing the scan depth up to thirty meters. Given that most two-lane roadways are close to thirty feet in width including the shoulder, using Recon-3D software appears to have an advantage.
A couple of other things quickly became obvious – the speed at which one could scan an object and the processing time for each software. Scaniverse had faster processing times. Using the fast processing option with Scaniverse averaged just a few seconds and took just slightly longer using the detail mode. Processing on the phone with Recon-3D took an average of about 25 to 30 minutes, although this time was significantly reduced when using its cloud processing option.
The advantage for quick processing in a field environment would be to be able to quickly discern between acceptable scans and the need to repeat scans. Recon3D offers enhanced accuracy through target recognition, while Scaniverse includes an image measuring tool and the option to export the model as an orbiting video.
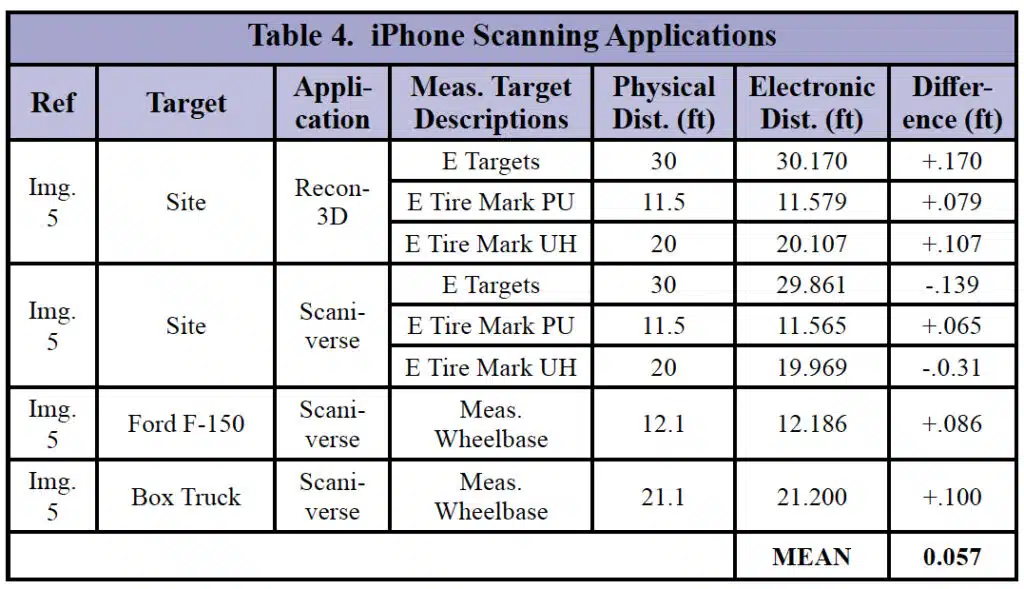
While other technologies might produce a denser cloud with higher visual quality; this test focus was not primarily on aesthetics, but on exploring a practical, low cost alternative for crash site evidence collection in a short period of time. This alternative also has the advantage of limiting dangerous roadway exposure for the operator. Even though the visual results of some scans might be of lesser quality than some other methods, we found in every case that pertinent roadway evidence could be identified, measured and, if required, digitized for utilization with other crash reconstruction softwares. Table 4 shows some of the measurements taken and compared through the iPhone application.
ADVANTAGES AND DISADVANTAGES
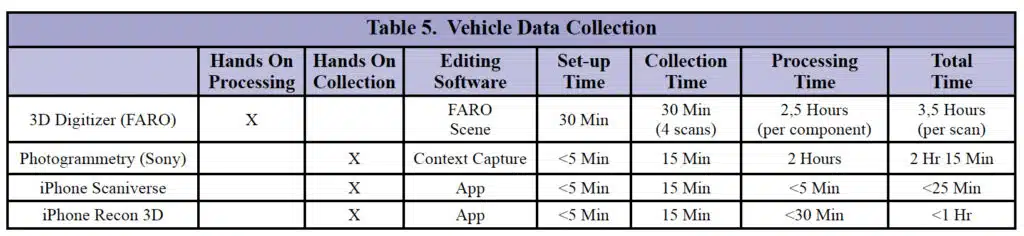
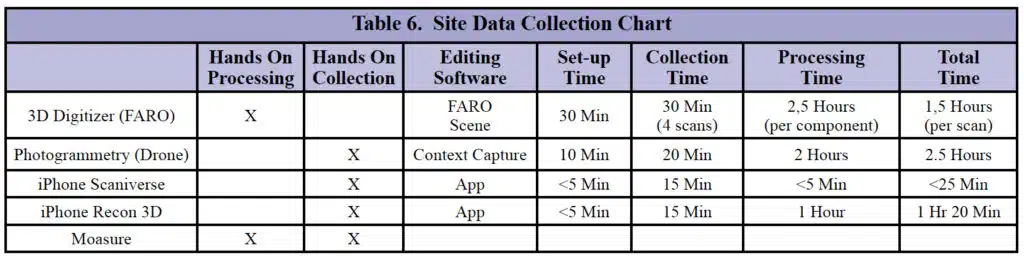
All technologies must be understood and used within their specific parameters and idiosyncrasies. Each technology had its own distinct advantages and disadvantages. These are summarized in Tables 5 and 6.
The FARO scanner is already court qualified with predictable and reliable results. In the collection phase, the user can set up, start the scanner and walk away to continue acquiring data by other methods. After a scan is com-plete, the user can preview the scan on a display screen. But the FARO scanner is large, heavy and cumbersome when moving to another scan location. Also, the user must be trained as to its peculiarities. For example, not using the inclinometer properly will skew the rotation of a scan. Even without having to correct inclinom-eter issues, processing FARO scans can take from 30 minutes to several hours, especially if there is a lot of excess scatter that needs to be removed. Additionally, during this whole process, the user is required to be at the workstation, actively engaged with the software.
The iPhone’s main advantages are its small size, portability and speed. Also, by using a selfie stick, a user can also capture the top of a vehicle, which is an advantage over FARO due to the portability restrictions of the 3-D digitizer. One large drawback, however, is trying to view the iPhone’s display screen during the scanning process.
All of the iPhone applications use some-thing to designate scanned/unscanned areas:
- Scaniverse – red and white diagonal lines for unscanned areas
- Sitescape – black for unscanned areas
- Recon-3D – green, yellow, red dots
- Polycam and PIX4Dcatch – white triangles for scanned areas
Even with the display’s brightness at 100%, the white lines and triangles can be difficult to see on a bright, sunny day. Once the scans are acquired, processing is started with the push of a button and can take less than a minute to several hours depending on the application and complexity of the object. The user is then free to work on other projects. One of the biggest advantages of Scaniverse is its fast-processing speeds. It scanned the F-150 in about 15 minutes and processed it in less than 5 minutes. This speed can be highly useful when in the field working with difficult elements, such as extreme weather conditions or tight time restrictions.
Similar to the iPhone, photogrammetry is “hands on” when collecting the data but “hands off” when processing. All the technologies have their disadvantages. The FARO scanner does not perform well with black, glossy surfaces, but the iPhone and photogrammetry have issues with large patches of white, smooth surfaces. None performs well with large, highly reflective surfaces like a windshield, but photogrammetry generates comparatively better results.
While there are tricks of the trade, such as spraying a temporary, washable powder on shiny surfaces prior to scanning or adding tie points during photogrammetry’s processing phase, the main issue is time. Time is money. And after evaluating the technologies and working within their own specific parameters and idiosyncrasies, we’ve determined the main advantage of using the newer, more portable technologies is the amount of time saved. Bulky 3D digitizers like the FARO can take up to three times as long to scan and process an object when compared to iPhone applications or photogrammetry, and the iPhone generated imagery looks similar or better.
CONCLUSION
In conclusion, we determined that all forms of technology we evaluated have been verified for accuracy with a minimal error mar-gin similar to existing court qualified technolo-gy. In addition, all technologies must be under-stood and worked within its specific parameters and idiosyncrasies. If properly applied in the right environment, all the tested technologies and tools can be useful to a crash investiga-tor when trying to understand what occurred during a crash event.
CITATIONS
1. “Daubert Standard.” Legal Information Institute, Legal Information Institute, https://www.law.cornell.edu/wex/daubert_stan-dard.
2. “Frye Standard.” Legal Information Institute, Legal Information Institute, https://www.law.cornell.edu/wex/frye_standard.
The Daubert standard1
The factors that may be considered in determining whether the methodology is valid are: (1) whether the theory or technique in question can be and has been tested; (2) whether it has been subjected to peer review and publication; (3) its known or potential error rate; (4) the existence and maintenance of standards controlling its operation; and (5) whether it has attracted widespread acceptance within a relevant scientific community.
The Frye standard2
This standard must determine whether the method by which that evidence was obtained was generally accepted by experts in the particular field in which it belongs.
Both standards hold requirements of the established method of data collection to be understood and approved by a variety of experts in the field. Validating and cross-checking methodologies has been essential in allowing all involved parties to evaluate processes to ensure accuracy. This test seeks to meet the expectations of these courtroom standards.
ACKNOWLEDGMENTS/AUTHOR BIOS
We would like to thank the following individuals for their invaluable help on this project: Mike Gonzalez (Lieutenant, Harris County Constable, Pct. 8), John Vaughn (Captain, Webster PD) and Robert Swint (CEO, ATA Associates, Inc,).
Allen Vaughan earned his B.S. Degree in Mechanical Engineering from Wright State University. He is currently an accident reconstructionist at ATA Associates, Inc. in Houston, TX and works frequently in automobile, heavy truck and conspicuity related accidents.
Cat Pate earned her M.A. Degree in Digital Media Studies from the University of Houston – Clear Lake. She is currently a technical associate at ATA Associates, Inc. in Houston, TX.
Randy Pazzaglia was ACTAR certified in1992 and is certified in automotive and heavy truck mechanical areas. Specializing in automotive crash reconstruction, as well as motorcycle and automotive mechanical failures, he has been a testifying expert for over 30 years and is the owner of MRCG Consulting in Bryan, TX